Capture troubleshooting information for Google Chrome issues
 Updated 2 years ago
by
Carla Sese
Updated 2 years ago
by
Carla Sese
Padlet developers do their best to help our users solve issues they face along the way. However, there will always be problems that are hard to get a handle on. We think the key to fixing a problem is to define it well.
Sometimes we need help and a lot more information. Besides our apps, Padlet is used in a lot of our web browsers, and Google Chrome is one of the most popular. Google Chrome comes with some tools that are often really useful at helping us figure out why a problem exists in the first place.
If a problem is intermittent, a screen-sharing session (our first suggestion for when an issue is something developers are unable to reproduce on our devices) might not be possible. The below offers some steps to follow to use Google Chrome to help us developers figure out what the issue is.
Step 1: Install a screen recording software and prepare to record.
If you're on a Mac, you can use Quick Time Player. It comes pre-installed. Read how to use Quick Time Player to record your screen here.
If you're on a Windows computer, you can use a tool like this free Online Screen Recorder. There's minimal install.
Step 2: Use Padlet like you usually do.
If it's an intermittent issue, keep using Padlet normally, and eventually, the issue should appear.
Step 3: Just before the issue presents itself, launch Google Chrome's Developer Tools
In Chrome, go to View > Developer > Javascript Console. A panel should pop out, similar to what you see below. (If you're wondering how to close the panel, click on the X on its top right. Closing the tab will also remove it from your screen.)The panel displays errors that happen on the page. The errors hint at why something is happening. Use Padlet and trigger the issue in the next step.
Step 4: Reproduce the issue while recording your screen.
Try to get your issue to show up again with the above panel visible while you're recording your screen.
Step 5: More panels!
You'll notice a lot of activity like what you're seeing below. All that activity serves as hints to developers as well.
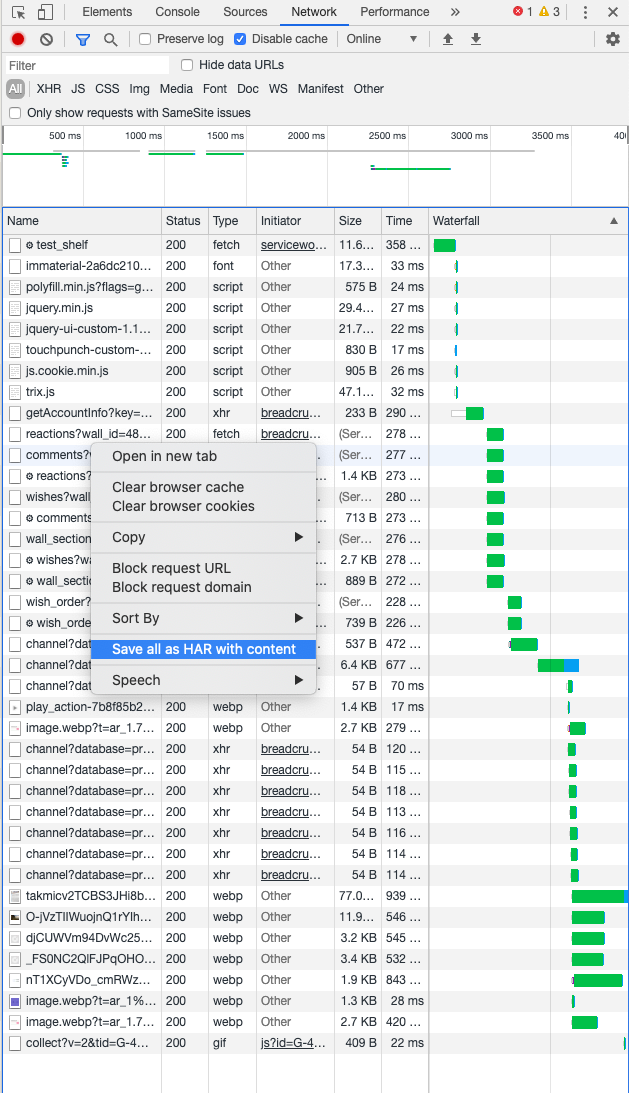
Step 6: Reproduce the issue while recording what happens in the Network tab
You'll notice a lot of activity like what you're seeing below. All that activity serves as hints to developers as well.
Step 7: In the Network tab, right-click on any one of the entries and select Save all as HAR with content